Bevölkerung der Stadt
Karte: Stadtgebiet der Landeshauptstadt Erfurt
Karte: © Stadtverwaltung Erfurt
| Bevölkerung | Anzahl |
|---|---|
| insgesamt | 215.199 |
| männlich | 105.172 |
| weiblich | 110.027 |
| Ausländer | 27.380 |
| Einwohnerdichte (Ew/km²) | 792 |
| Durchschnittsalter (Jahre) | 44,9 |
| Haushalte1 | 116.476 |
1 Stand der Haushalte ist der 31.12.2018 (einschließlich Wohnheime)
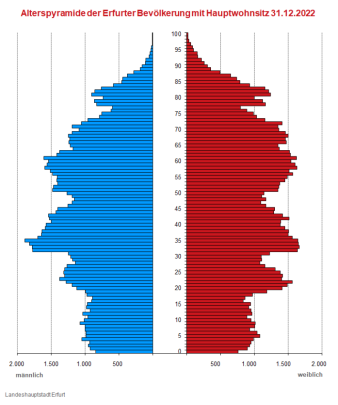
Altersstruktur der Bevölkerung in Erfurt
Grafik: Altersstruktur Bevölkerung
Grafik: © Stadtverwaltung Erfurt
| Altersgruppen von bis unter Jahre |
insgesamt | männlich | weiblich |
|---|---|---|---|
| 0 - 3 | 4.454 | 2.310 | 2.144 |
| 3 - 6 | 5.407 | 2.720 | 2.687 |
| 6 - 15 | 17.879 | 9.076 | 8.803 |
| 15 - 18 | 5.768 | 2.941 | 2.827 |
| 18 - 25 | 18.326 | 8.719 | 9.607 |
| 25 - 45 | 57.547 | 30.110 | 27.437 |
| 45 - 60 | 40.136 | 20.417 | 19.719 |
| 60 - 65 | 15.376 | 7.515 | 7.861 |
| 65 - 80 | 33.517 | 14.923 | 18.594 |
| 80 Jahre und älter | 16.789 | 6.441 | 10.348 |
| insgesamt | 215.199 | 105.172 | 110.027 |
Bevölkerungsentwicklung
| Jahr | insgesamt | männlich | weiblich | Ausländer |
|---|---|---|---|---|
| 2024 | 215.199 | 105.172 | 110.027 | 27.380 |
| 2023 | 216.267 | 105.526 | 110.741 | 26.881 |
| 2022 | 215.520 | 104.905 | 110.615 | 24.833 |
| 2021 | 213.835 | 104.363 | 109.472 | 21.409 |
| 2020 | 214.174 | 104.575 | 109.599 | 20.007 |
| 2019 | 214.417 | 104.630 | 109.787 | 18.811 |
| 2018 | 214.109 | 104.480 | 109.629 | 18.036 |
| 2017 | 213.354 | 104.225 | 109.129 | 16.451 |
| 2016 | 211.590 | 103.155 | 108.435 | 14.242 |
| 2015 | 210.271 | 102.557 | 107.714 | 12.793 |
| 2014 | 206.380 | 99.943 | 106.437 | 9.047 |
| 2013 | 205.112 | 99.094 | 106.018 | 8.306 |
| 2012 | 203.679 | 98.267 | 105.412 | 7.724 |
| 2011 | 202.270 | 97.480 | 104.790 | 6.761 |
| 2010 | 200.949 | 96.791 | 104.158 | 6.338 |
| 2009 | 199.952 | 96.223 | 103.729 | 6.086 |
| 2008 | 199.416 | 95.964 | 103.452 | 5.989 |
| 2007 | 199.242 | 95.895 | 103.347 | 6.043 |
| 2006 | 199.114 | 95.815 | 103.299 | 5.825 |
| 2005 | 199.382 | 95.912 | 103.470 | 5.822 |
| 2004 | 199.088 | 95.784 | 103.304 | 5.646 |
| 2003 | 198.181 | 95.266 | 102.915 | 5.033 |
| 2002 | 196.517 | 94.608 | 101.909 | 4.688 |
| 2001 | 196.815 | 94.644 | 102.171 | 4.351 |
| 2000 | 197.350 | 94.715 | 102.635 | 4.001 |
| 1999 | 198.178 | 95.051 | 103.127 | 3.826 |
| 1998 | 201.069 | 96.365 | 104.704 | 3.614 |
| 1997 | 204.054 | 97.809 | 106.245 | 3.395 |
| 1996 | 207.113 | 99.221 | 107.892 | 3.123 |
| 1995 | 210.468 | 100.686 | 109.782 | 2.809 |
| 1994 | 213.171 | 101.813 | 111.358 | 2.656 |
* Die jährlichen Bestandsdaten werden zum Stichtag 31.12. des jeweiligen Jahres ermittelt.
| Jahr | Geburten | Sterbefälle | Zuzug | Fortzug |
|---|---|---|---|---|
| 2024 | 1.458 | 2.520 | 10.699 | 9.991 |
| 2023 | 1.587 | 2.621 | 11.594 | 9.697 |
| 2022 | 1.647 | 2.718 | 13.355 | 10.289 |
| 2021 | 1.903 | 2.785 | 10.018 | 9.719 |
| 2020 | 1.990 | 2.445 | 9.850 | 9.800 |
| 2019 | 2.062 | 2.327 | 10.828 | 10.156 |
| 2018 | 2.167 | 2.534 | 11.590 | 10.552 |
| 2017 | 2.190 | 2.488 | 12.098 | 10.232 |
| 2016 | 2.163 | 2.375 | 11.438 | 9.962 |
| 2015 | 2.046 | 2.267 | 13.536 | 9.708 |
| 2014 | 2.138 | 2.236 | 10.773 | 9.388 |
| 2013 | 2.091 | 2.193 | 10.179 | 8.694 |
| 2012 | 1.987 | 2.203 | 10.248 | 8.602 |
| 2011 | 1.813 | 2.119 | 10.277 | 8.710 |
| 2010 | 2.034 | 2.076 | 9.160 | 7.991 |
| 2009 | 1.825 | 2.166 | 9.178 | 8.215 |
| 2008 | 1.887 | 2.081 | 8.785 | 8.262 |
| 2007 | 1.903 | 2.043 | 8.473 | 8.060 |
| 2006 | 1.710 | 1.995 | 8.254 | 8.185 |
| 2005 | 1.715 | 1.995 | 8.647 | 7.979 |
| 2004 | 1.760 | 1.980 | 9.213 | 7.892 |
| 2003 | 1.705 | 2.079 | 9.270 | 7.220 |
| 2002 | 1.629 | 2.031 | 7.241 | 7.191 |
| 2001 | 1.695 | 1.943 | 7.031 | 7.360 |
| 2000 | 1.707 | 2.050 | 6.866 | 7.320 |
| 1999 | 1.553 | 2.025 | 6.168 | 7.335 |
| 1998 | 1.455 | 1.952 | 5.836 | 7.789 |
| 1997 | 1.426 | 2.077 | 5.788 | 8.080 |
| 1996 | 1.301 | 2.103 | 5.193 | 7.762 |
| 1995 | 1.202 | 2.235 | 4.831 | 6.498 |
| 1994 | 1.082 | 2.230 | 4.137 | 6.551 |
** Die Bewegungsdaten werden in der Regel zum 31.03. des Folgejahres nach dem Ereignisdatum des Meldevorganges ermittelt.


